
BP Chief Economist Spencer Dale presented his company’s 65th edition of the Statistical Review of World Energy June 2016 in Moscow on June 10 at the Institute of World Economy and International Relations. BP has been producing the report since 1952, and the study has established itself as an authoritative source in the energy industry.
The report, which in its inaugural year, only reported on oil – now focused on the three primary global energy sources – oil, coal, and natural gas.
Oil remains the most widespread used energy in the world – in 2015 it accounted for 32.9% of total energy consumption. In 2015, it even saw its market share rise, for the first time since 1999. After oil, coal is the second biggest fuel, with 29.2% share in the energy balance, but it saw its market share decline in 2015. Natural gas made up 23.8%.
Dale’s main message for the upcoming year is to expect another year of strong growth in demand, and a continued shift towards low-carbon fuels, as well as renewables.
According to the report, global demand for primary energy only amounted to 1%, which is significantly lower than the average in the past decade (on average 1.9%).
Dale said this reflects an overall slowdown in the global economy and consequential slower growth in energy consumption, most notably in China.
Oil
“On the demand side, we are in a world where demand is in a period of transition. Over the last 10-15 years, we have seen very strong growth in global energy demand, much of that driven by China,” he said.
China’s economic boom days are over, and as Dale put it, “the days of double-digit growth and industrialization are behind us”.
Even if there is a massive increase in demand – from China or elsewhere – the massive amount of oil inventories will offset any oil price surges.
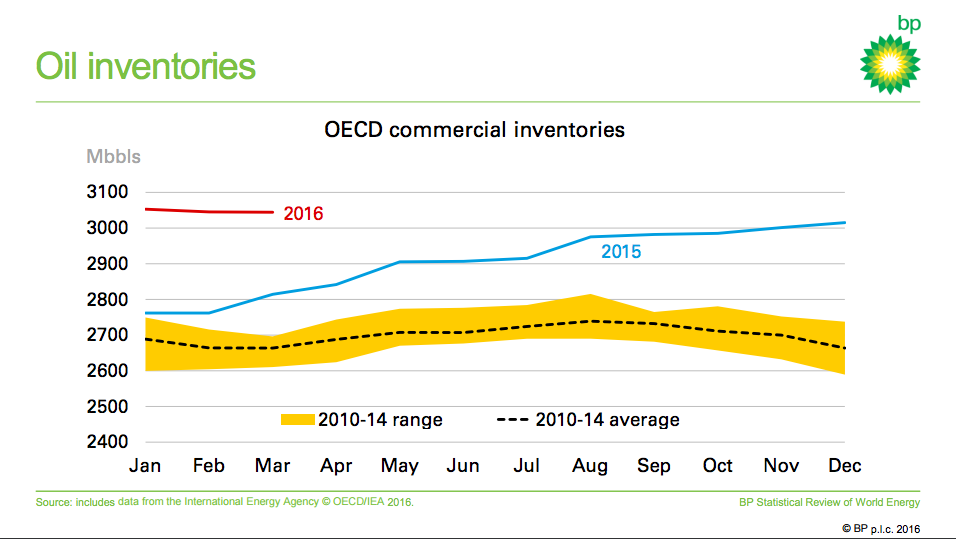
For example, even if demand grows to a point where there is a shortage of oil, prices won’t suddenly snap back.
Dale explained: “If you have a shortage of a 1 million barrels per day, but we have a surplus of 500-600 million barrels, simple arithmetic tells you that it could easily take 12-18 months before stock levels are back to normal levels, and it’s only when you work off that significant stock overhang, will the oil market come back to balance.”
Technology is also changing the energy balance, the report says, referencing developments in both shale oil in the US, as well as renewable energy sources worldwide.
“On the supply side, we are surfing a technological wave. Over the last few years, we have seen rapid gains in technology advancements and productivity gains, which are increasing the types and abundance of energy supplies,” said Dale.
As our readers know very well, oil prices in 2015 dropped drastically. In dollar terms, the largest drop on record, and the sharpest fall in terms of percent since 1986. Prices rose slightly in early 2015 as US shale producers nixed production, but increased production by OPEC countries, especially Iraq and Saudi Arabia (account for ~90 percent of increase production) caused a sharp drop in prices overall.
We are “truly in an age of plenty in terms of supply,” Dale noted.
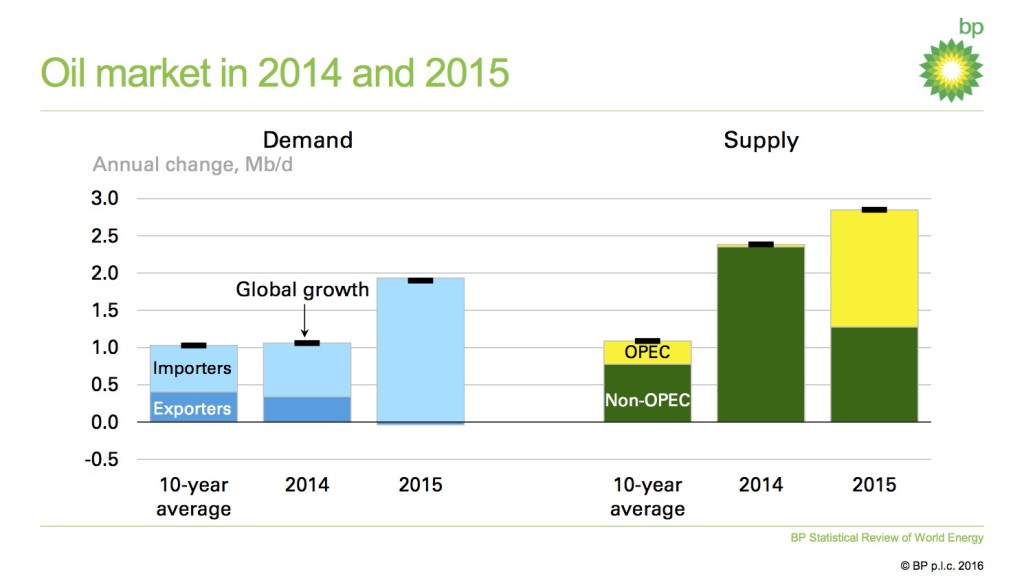
The growth rate of world oil production for the second year in a row outpaced global consumption growth. Production grew by 2.8 million barrels per day, or 3.2%, the highest rate since 2004. Production in Iraq (750,000 barrels per day) and Saudi Arabia (510,000 barrels per day) rose to record levels, which pushed OPEC production up 1.6 million barrels per day to 38.2 million barrels per day, even outpacing the previous record set in 2012.
“You do not need a PhD in economics to know if supply grows by 2 million barrels a day, and demand grows by 1 million barrels a day – what will happen with oil prices – and sure enough, prices fell,” said Dale.
Natural Gas
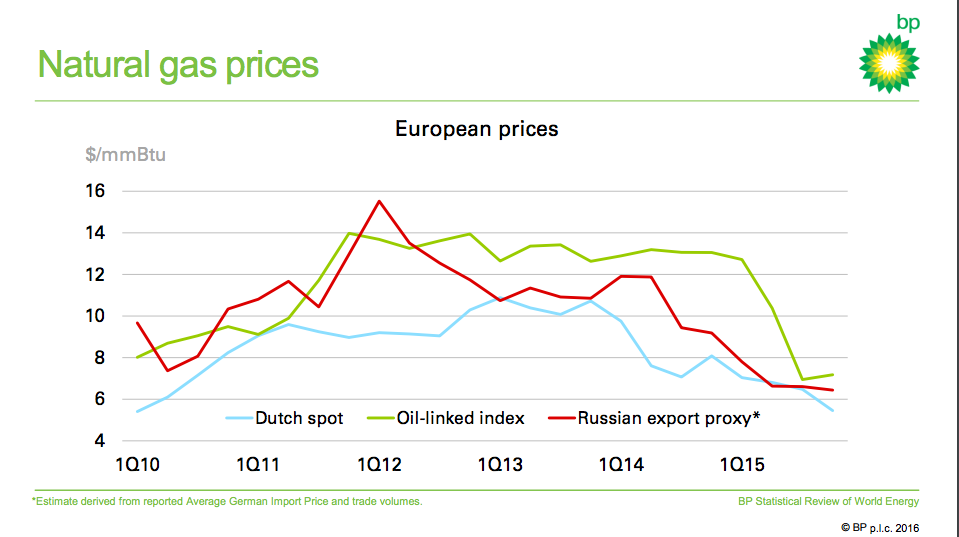
“The big picture story on natural gas is one where global production continued to grow strongly, but demand outside of the power sector was relatively muted, and these two things together causes gas prices to drop sharply around the world,” said Dale.
There is still a large variation across countries and markets.
“On the supply side, the US remained the global powerhouse for natural gas, accounting for around half of the entire increase in global production last year,” according to the economist.
Overall, BP sees three general themes from the gas market:
1) A gas increase share within power sector, especially in the US, even pricing out coal;
2) LNG overall increased, though demand from Asia decreased, and increased in Europe, North Africa, and the Middle East;
3) In order to retain market share, Gazprom responded to increased competition by lowering European prices
The rise of LNG is increasingly influencing prices. For example, a drop in demand for LNG in Asia affected prices in natural gas in Europe.
Other interesting points of the presentation:
– Gas overtook coal in US power sector – first time ever
– Renewable energy – solar energy has increased 60-fold in the last 10 years