
Jarand Rystad, CEO of Rystad Energy, an oil and gas research analysis firm, presented his company’s forecast for future oil prices based on an economic simulated model at the Primakov National Research Institute of World Economy and International Relations (IMEMO), Russian Academy of Sciences, in Moscow on December 14, 2017. In short, oil prices in 2025 could range anywhere from $20 to $140, but it largely depends if the oil market is oversupplied or undersupplied in 2021, 2022, and 2023.
The model takes into account both supply and demand factors, which ultimately are driven by current oil prices. Investments in new onshore and offshore projects are made when oil prices are high, and pulled back in a bearish market.
To make a simple analogy, Rystad told an anecdote about pork prices in Germany from the late 19th century into the early 20th century. An economist noticed that prices for the meat nearly always soared around Christmastime, and periods of high prices would last for about two years at a time, before going into a 2-year slump. This is due to the simple fact that once farmers saw their neighbors making windfall profits during times of plenty, they too decided to invest in a hog farm. However, in the two years it took to start producing at full capacity, a lot of other farmers had had the same idea, and then there was a massive oversupply in the market. At this point, farmers decided their venture wasn’t worth it, closed up shop, and eventually, this created higher demand.
Rystad explains that is one of the first recorded analysis of a boom-bust commodity cycle, and likens the general principle to oil prices and demand/supply. What they found is that it isn’t all that different and that a perfect linear relationship exists between the decision to drill a new oil well and current oil prices.
“Basically, oil managers are taking decisions based on the current oil price and average oil price over the last year,” Rystad asserted.
Future oil investments have a strong correlation to current oil prices. “If it has been high for 3 years, it will be low for 3 years. It’s quite symmetrical,” said Rystad, adding that of course shocks from demand (the financial crisis), supply (war in the Middle East, pipeline disruptions), or structural (disruption by mobile vehicles) complicate the dynamic oil price simulation that he and his colleagues at Rystad are working on.
When oil prices are at $140 per barrel, every producer is investing into the industry, but when prices fall below $40, for example, smaller players get squeezed out.
The Model – Supply, Demand, and Peak Oil
Predicting oil prices into today’s complex world has a lot more inputs than the simple days of raising hog some 100 years ago. Rystad’s model relied on something called the implicit stock build – the relationship between supply and demand. The strongest relationship between the current oil price (log) and accumulated stock draw painted a clearer picture of what to expect in the future.
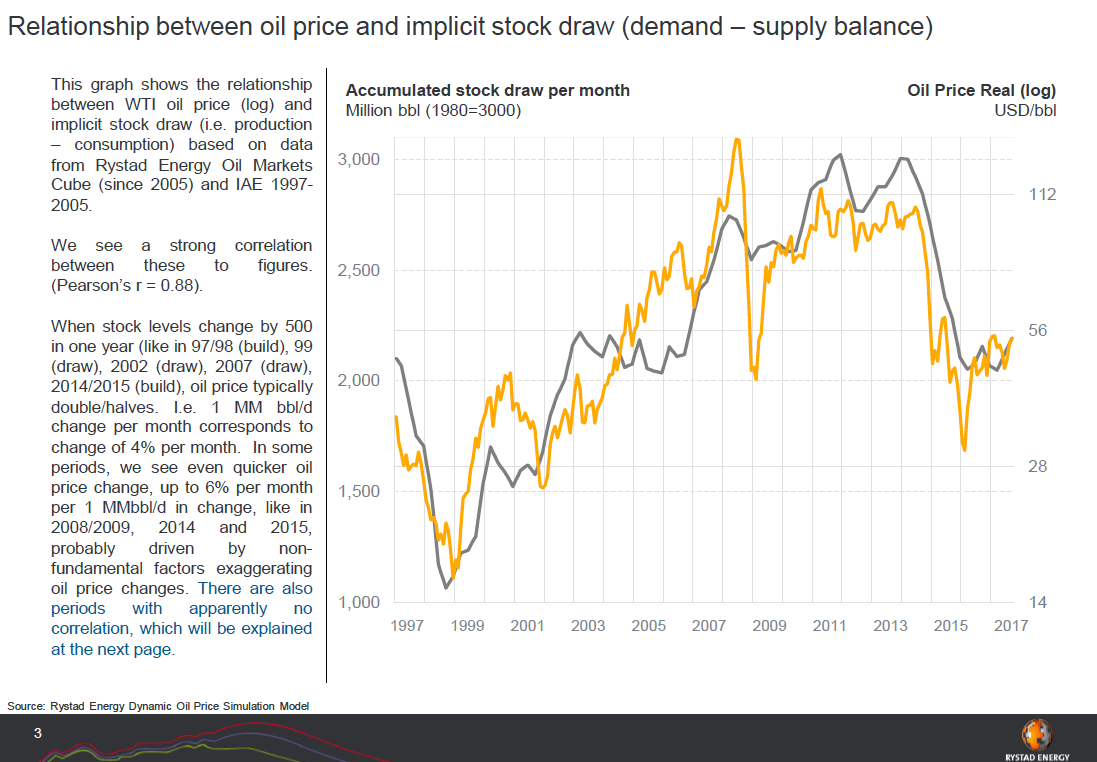
“The functional relationship is that if you have a stock drop of 1 million barrels per day, in a half a year, oil price changes 30%. So, if the oil price is $50, and you have a stock drop of 1 million barrels per day in a half year. 30% of 50 is 15%, then the oil price will be $65 at the end of the year. This is pretty much what we’ve seen this fall, for example. There is a pretty clear historical correlation,” Rystad explained.
“If you have a very fast very responsive oil price, you will get a somewhat different pattern – a double peak in the oil market. If you have a very slow reaction – like 3% –you get a slower and longer cycle.”
The length of an investment cycle greatly varies depending on whether the product is onshore or offshore.
The offshore (long) cycle is longer, lasting 5-7 years after a final investment decision (FID) is taken. The ‘long’ cycle can add an extra 1-2.5 million barrels of oil to the global supply, and up to 3 million barrels in a peak year. Investment in offshore, unlike onshore, is mostly spent on the facilities (80%) compared to the wells (20%).
The onshore (short) cycle is much more streamlined and results can be seen anywhere from 1-2 years after an FID decision is taken. The impact of the short cycle is much more dynamic and can add 6.5 million new barrels of oil in as short of a time period as 7 months, which is the case for shale/tight oil. Infrastructure is already in place, and do not have to be built from scratch like offshore (nor are they as technically complicated) so about 60-70% of investments are well investments.
“One other relationship we need to look is whether investments follow current oil prices or are people thinking more strategically? An example of this is the new horizontal shale wells. There was a structural growth from 2010 to 2013 since they had to learn how to switch from vertical wells to horizontal wells, but after that, it has been an almost perfect, linear relationship between the drilling of new wells and the actual oil price,” Rystad said.
This is true with both Brent and WTI benchmarks, with an even stronger correlation between the number of new wells drilled and WTI price.
“It’s a very strong functional relationship, and it’s the same for infield wells. We see that it very much follows the current oil prices. And when you look at field development decisions, they are correlated to decisions made in the previous year. Basically, oil managers are making decisions based on the current oil price and average oil price over the last year,” explained Rystad.
OPEC Restrictions Only Benefit Shale Oil
The most common, though unpredictable, example of supply disruptions today comes from Vienna by way of OPEC: the organization’s decision to expand or limit production has a great impact on investment cycles worldwide.
In Rystad’s OPEC production cut model, they predict that the body of oil-producing countries wants to keep the price of oil propped above $60 per barrel, the range oil indices have been hovering at since OPEC decided to limit production in 2016 in order to prop up global oil prices (or to squeeze out American shale producers, whatever your view is).
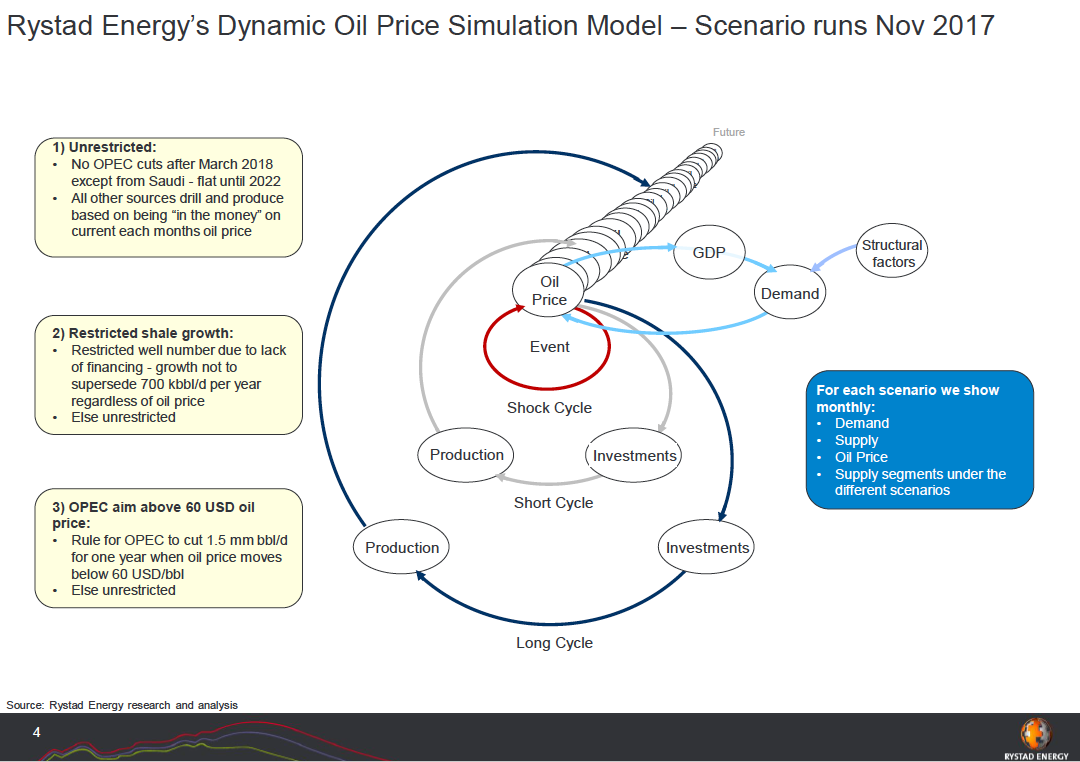
Once OPEC decides to end its production hold, there will be a boom of new oil onto the market. “If the oil price goes below $60, OPEC will cut 1.5 million barrels for one year. This is a rigid allegory for OPEC. I don’t think they will have the discipline to do that,” said Rystad.
“Every time the oil price goes to $60, OPEC cuts, and the oil price will oscillate between $60 and $80, which is what we think now is the marginal cost of suppliers: $70 in these cases. The oil prices will not be allowed to have a downturn, but you also will not turn off the short cycle sufficiently to get a real off turn. In this decision, this is the scenario where shale will get the largest global market share. The one that will benefit the most from OPEC cutting is actually shale,” Rystad continued.
“Many people think that shale cannot go on growing as fast as today. Investors will say to stop, they aren’t getting sufficient reserves, etc. The exact reason isn’t important, but we can make a scenario when we put the restriction into the model,” he said.
In the case that OPEC ends its production freezes, the market will again be oversupplied and oil prices will dip below $40 and wipe out all short cycle (shale and infield drilling). This doesn’t have a major effect as long as it follows a relative strong long cycle of investment, such as the volumes investments made in 2011, 2012, and 2013 to develop new fields. The long investment cycle usually spills over 4-6 years in the future. If for example, there was a price collapse in 2019, this could lead to a huge undersupply in 2021, 2022, and 2023, and oil prices could jump to $140 and remain at these levels for 2-3 years.
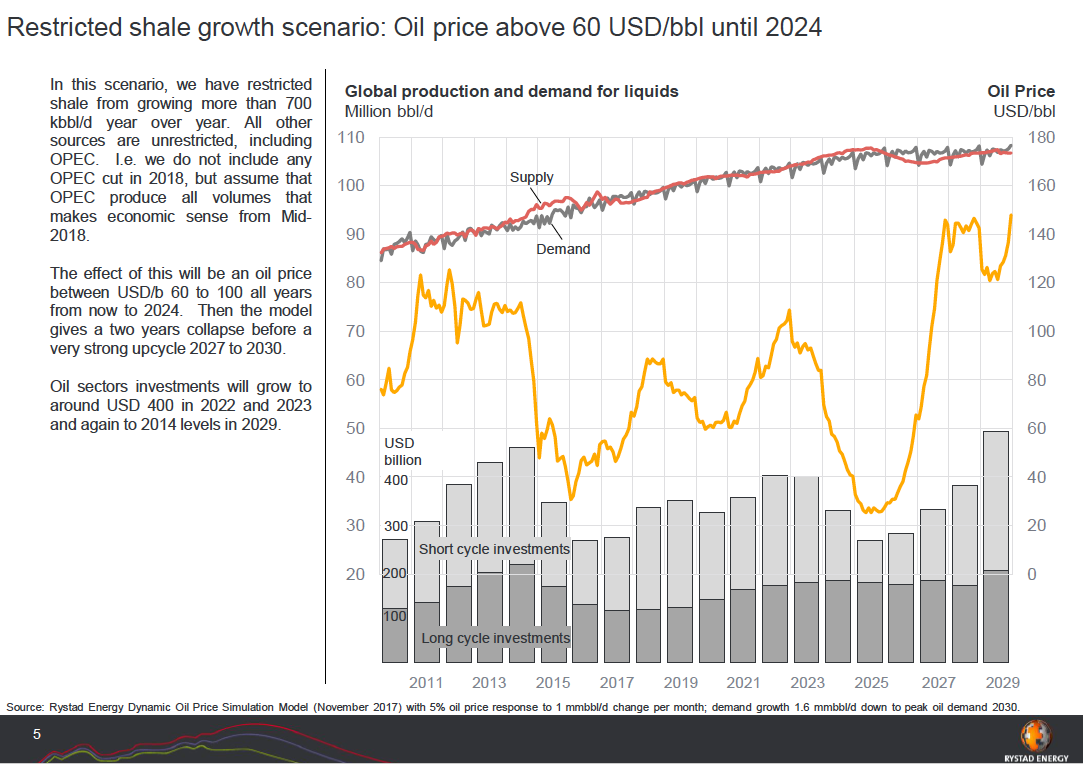
Then, predictably, investors will go crazy and invest as much money as they can into oil. Once the money is poured into development, it will still take a couple years to get all the oil on the market, and only in 2025 would a super over supply occur and prices collapse as a result. Rystad explained that this scenario wouldn’t be a shock, because it is quite similar to the super oversupply that we witnessed at the end of the last cycle, and that in fact the pattern is just repeating.
Disruptions, Peak Oil, and the Power of Shale
Supply and demand are the most important inputs into the model, but there are also larger, structural shifts that Rystad had to account for. One of those was the rapid increase of crude tankers from the Middle East to China.
“The oil in the tankers grew from 930 million barrels to 1235 million barrels. So, what happened is that the total supply change expanded proportionally,” said Rystad.
In Asia, another major shift was that China began stashing away strategic reserves (similar to the US oil stockpile), so the analytical team had to incorporate these into the supply chain size in the model.
In Europe and America, a larger structural demand change is underway with the development of renewable energy sources (and government support for the initiatives) as well as electric cars. As these developments accelerate and become the new norm, the demand for oil will wane, and much of the world’s oil may forever be left untouched underground.
That said, we will still witness a peak oil demand in our lifetimes, whether it’s in 10, 20, or 30 years.
“Demand is flattening out because we have a peak oil demand in the model – it’s 2035. We are experimenting with three different peak oil scenarios – 2025, 2030, and 2035. The simulation shows you get longer down periods if you have an earlier peak demand. So, if we have peak demand in 2025, we will see 2-3 years upcycle, and 4-6 years down cycle. So, it, of course, has a negative impact on the oil market if we have an earlier peak demand, but we will still get price flare-ups,” Rystad said.
Peak oil demand aside, Rystad is still bullish on investment into shale resources, especially in the US.
“The world is totally dependent on shale. Even if you make a scenario with a flat shale production, the world would run into an energy crisis – we wouldn’t have enough energy. We need shale to grow going forward.”
PRESENTATION TIMESTAMPS
1:05 –1927 pork prices in Germany – the original boom-bust cycle
5:15 – In the last decade, 89% of oil industry investments have been in offshore
5:24 – On peak years, investment cycles can spur an additional 3 million barrels in production in offshore
8:59 – Shale and tight oil short cycle is only 7 months from price signal to decision to drill to completion
9:44 – Typical well level decline is 8 million barrels, new wells declining faster
10:15 – Short cycle providing new 6.5 million barrels of oil, long cycle up to 3 million barrels
11:18 – Percentage change in oil price / accumulated stock draw
12:35 – Formula for predicting change in oil price
13:30 – Asian demand super cycle
16:30 – Perfect linear relationship between drilling of new wells and oil price
18:27 – Oil Simulation based on OPEC decisions
22:39 – Restricted shale development means $60+ oil prices through 2024
24:04 – A scenario in which we see $140 per barrel by 2021
24:33 – “In 2025 we get a new super oversupply with a complete price collapse as a result.”
26:32 – “The world is totally dependent on shale”
29:49 – Shale benefits most from OPEC cuts
32:34 – Peak oil demand by 2035
35:27 – We will only see an upturn in deep-water if shale is restricted from growth
37:40 – The year 2014 could have been peak investment year ever in the oil industry
38:32 – Given investments made up until 2017, the world will produce 68 million barrels of oil in 2025, and decisions going forward could add an additional 37 million barrels
39:14 – The next 8 years will be a very dynamic oil market